
⭒᧔The Stellar Spectra: History᧓☪
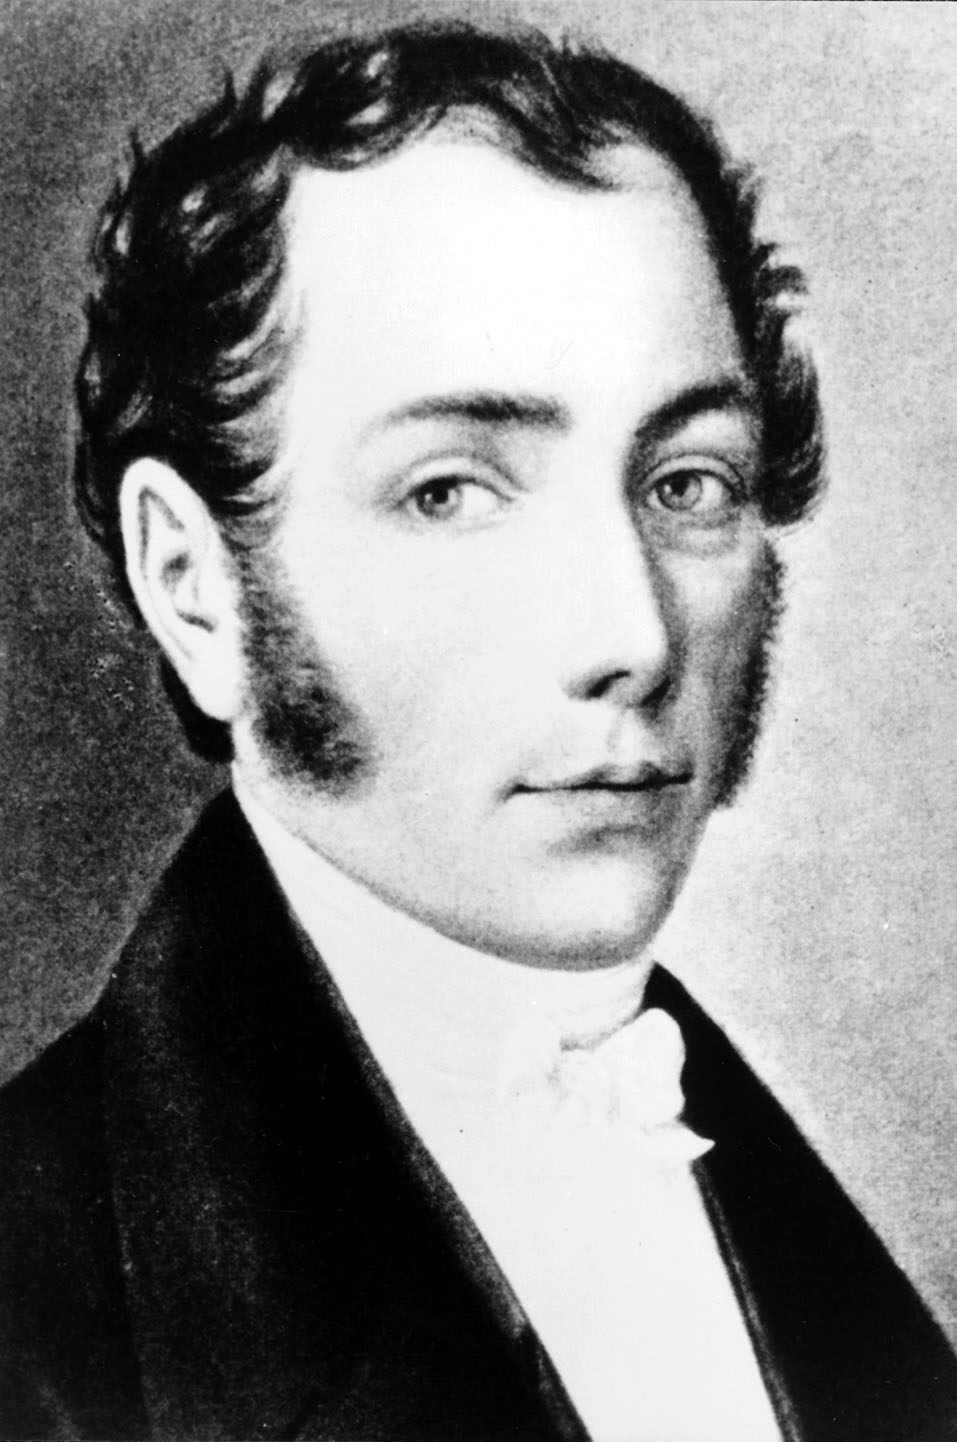
The study of stellar spectra began with the observations of Joseph von Fraunhofer, a German physicist, between 1814-1817. He published a book in 1823, detailing the Sun’s spectrum made up of the measurements of the wavelengths of 500 dark absorption lines, many of which are still labeled with the letters he assigned. The absorption lines were labeled alphabetically (A, B, C, etc..) based on the strength of the wavelengths, with A being the strongest lines, and the rest progressively getting weaker.

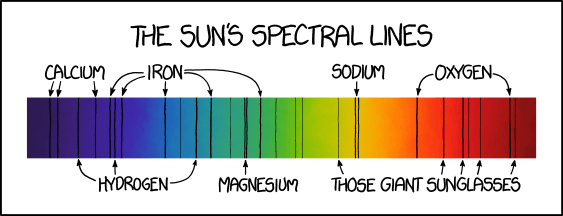
Later, in 1860, laboratory observations conducted by Gustav Kirchhoff and Robert Bunsen demonstrated that heated chemical elements produce spectral emission lines, while the same elemental gas or vapor absorbs specific wavelengths. This allows corresponding absorption lines to appear when broadband light passes through the gas.This discovery also allowed scientists to identify the chemical elements present in stars by matching stellar absorption lines with laboratory emission spectra, opening the possibility to measure a star’s radial motion relative to Earth through Doppler shifts in the wavelengths of these spectral lines.

Four years later, William Huggins, an English astronomer, found several chemical elements in the emission lines of various nebulae. This established that nebulae, and stars, are composed mainly of incandescent gas, rather than aggregations. Soon afterward he identified the presence of hydrocarbons in comets, and, in 1868, became the first to measure the radial velocity of a star using the Doppler shift of its spectral lines. He used instruments like the automatic prism spectrographs, which was made by Lewis Rutherfurd, an American lawyer and astronomer, in 1863.
Furthermore, between 1863-1870, Father Angelo Secchi, a Jesuit astronomer, developed one of the first spectral classification schemes for stars, which divided them into four main spectral types based on their color and spectral appearance.
Type I: White/Bluish stars
Characterized by strong hydrogen absorption lines
Type II: Yellow stars
Characterized by spectra with numerous weak metallic lines.
Type III: Orange/Red stars
Complex spectra with broad dark absorption bands, often associated with titanium oxide.
Type IV: Deep Red stars
Described as “extraordinary,” often showing the presence of carbon.
Type V: Emission-line stars
Bright emission lines dominate rather than absorption lines.
Years later, Henry Rowland, an American physicist, developed high-dispersion diffraction gratings in the 1880s–1890s. Using a spectrograph of his own design, Rowland photographed the Sun’s spectrum, spreading sunlight into its component wavelengths and producing a 40-foot-long image containing over 20,000 individual solar absorption lines.
A hypothesis about why stars differ in color along with their spectral features, was proposed by Hermann von Helmholtz, in 1863, and James Homer Lane, in 1871.
Later, in 1885, the Harvard College Observatory created a photographic survey of 10,351 stellar spectra, and classification of the spectra for the first Henry Draper Catalogue was performed under the supervision of Williamina Fleming.
This work led to the application of the letters A-M labeling over the four subdivisions of Secchi’s categories to represent the decrease in hydrogen present in absorption lines. In addition to that, categories O, P and Q were added in order to categorize objects that oddly showed emission lines, such as Wolf-Rayet stars, planetary nebulae and novae. However, in order to expand categorization, a team of labor was required. This team was notably comprised of Antonia Maury and Annie Jump Cannon.
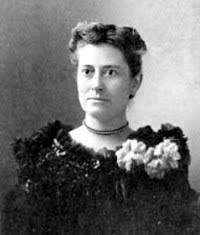
Antonia Maury
Maury developed a complex categorization, partly based on both the temperature and the width of spectral lines. This system made differences in magnitude and proper motion across the O, B, G and M spectral types apparent, which opened the way for the Hertzsprung-Russell diagram.
Annie Jump Cannon
Cannon created a classification that relied on both the appearance and disappearance of specific spectral features, becoming the first person to correctly order all stars in a temperature sequence. Her system contained several different categories with some letter labels repurposed to form the now familiar spectral type sequence. Furthermore, she added a numerical division of categories into 10 subgroups to help precisely specify differences present within stars in each stellar category. Her system was published in 1912, and was made a provisional standard by the International Astronomical Union.
Fundamental advancements post-Annie Cannon (Mostly)
Max Planck's equations for blackbody radiation using a quantum theory of energy.
Niels Bohr's electron shell theory of atomic structure.
Elucidation of the mass/luminosity relationship by Ejnar Hertzsprung and H.N. Russell.
Description of atomic ionization states by Megh Nad Saha.
Cecilia Payne-Gaposchkin identified elemental ionization states produced by different surface temperatures and with that discovery, deduced that stars consisted mostly of hydrogen.
Hans Bethe described the nuclear fusion processes that generate stellar energy.
Adding on to Hans Bethe, Subrahmanyan Chandrasekhar created a theory of a star's evolution, which included the gravitational collapse that produces supernovae and white dwarfs.
William Morgan, Philip Keenan and Edith Kellman combine luminosity codes with the Harvard spectral types to form a classification in the Atlas of Stellar Spectra.